Management dimension

Guiding without measuring is moving in the dark.

An annual survey captures just a snapshot. Komit surfaces signals that evolve year-round, helping your teams act at the right time.

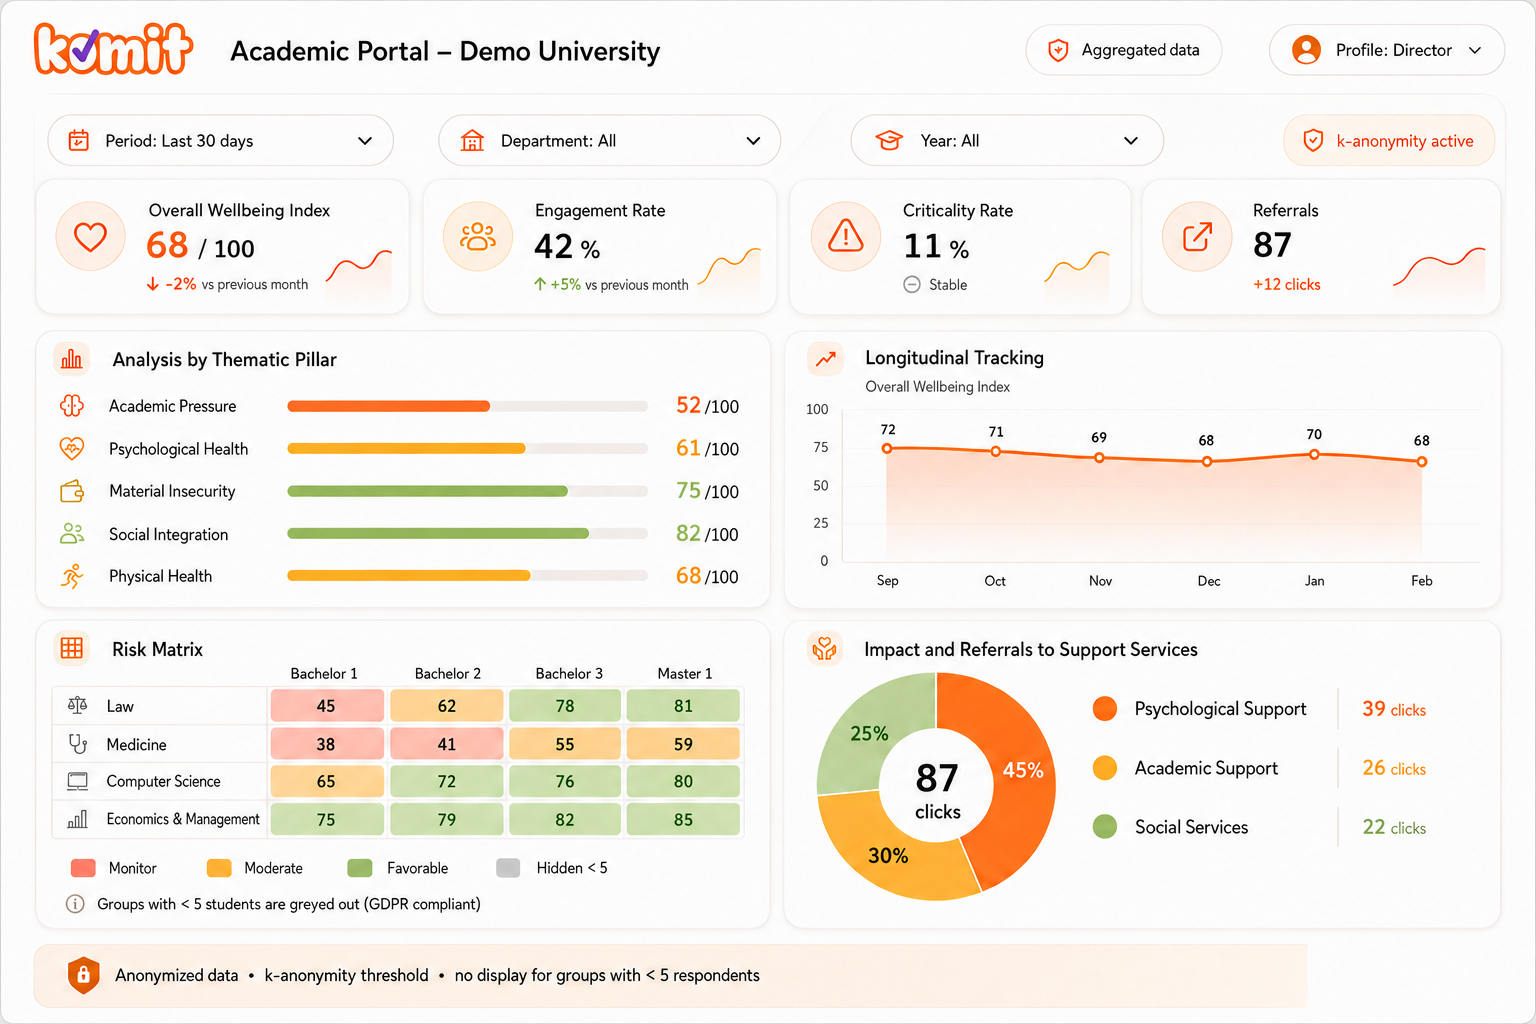
Komit dashboard with indicators, longitudinal tracking, risk matrix, and support routing

Continuous view

Track how indicators evolve over time.

Cohort filters

Analyze by department, programme, class year, and timeframe.

Actionable signals

Quickly spot areas of concern to act at the right moment.

A new way to measure

One snapshot a year doesn't tell the whole story.

Between two surveys, needs evolve. Weak signals do too.

Annual survey

A one-time snapshot

What happens before and after remains unseen.

Continuous guidance with Komit

Continuous longitudinal view

Track trends over time and step in when it matters.

Stay one step ahead

What if your next critical signal appeared between two surveys?

With continuous signals, teams no longer discover changes months too late. They have the context they need to make timely decisions.

Continuous
vision
Dec.Jan.Feb.Mar.Apr.MayJun.Jul.Aug.Sep.Oct.Nov. 1 2 3
1
Signal detected An initial indicator shifts
2
Trend confirmed The pattern persists
3
Action tracked Impact is measured
ObserveUnderstandAct

A shared vision

The right information for the right team.

Each role accesses actionable insights tailored to their mission, without exposing any individual data.

Leadership

Campus-wide overview

Track institutional trends and inform strategic decisions.

Overall Wellbeing Index
68 /100
Engagement Rate
42 %
Criticality Rate
11 %
- 0.3 pts
Support Referrals
87
+12 clicks
Participation
78 %
+ 4%

Academic Leads

Understand each context

Compare trends by department, programme, cohort, or academic year.

Timeframe: Last 30 days ∨ Department: All ∨ Year: All ∨ Programme: Computer Science Cohort: Year 2 ∨
Overall Wellbeing Index
Sep.Oct.Nov.Dec.Jan.Feb.

Support Services

Anticipate needs

Identify rising topics and adapt available campus resources.

Trends by topic
Academic Pressure +12 pts
Mental Health +8 pts
Financial Stress -3 pts
Social Integration +2 pts
Sense of Purpose +6 pts
Support referrals (aggregated)
87 clicks
Psychological 39
Academic success 26
Social aid 22

Privacy by design

Understand trends without tracking individuals.

Komit aggregates responses into collective indicators before they ever reach the dashboard.

1

Voluntary check-ins

2

Secure aggregation

Aggregation and processing
before analytics

Department Programme
Year
3

Privacy thresholds

Displayed from
5 respondents
Groups < 5: hidden
4

Aggregated trends

Overall Wellbeing Index
68 /100 ↓ -2% vs prev. month
Analysis by topic
52/100
61/100
75/100
82/100
68/100

What research reveals

Signals exist long before they become visible.

Listening closely doesn't create problems. It allows you to address them sooner.

≈50%

of students report low wellbeing

EUROSTUDENT sample, WHO-5 scale ↗
19%

report very low wellbeing

19 out of 100 81 out of 100
65%

report being unaware of available campus help

Hope Center, USA, 2023–2024 ↗